3-week XRP Gain Wiped Out In 6 Hours
Today’s XRP price line hit a new low of $0.633. After being rejected at $0.873, XRP has been steadily dropping for two weeks.
- Bears in Charge
While the bears dominated, there were a few brief rallies as the bulls tried to stem the price slide. Regardless, the general downward trend continued today, with the XRP price about matching that of February 4.
Destroying all gains earned so far this month, the selling pressure has accelerated in the last 24 hours. While $0.617 is far away, XRP may challenge this level if the current downturn does not reverse.
- XRP 24-Hour Chart Performance
The 24-hour chart shows XRP is still negative, with a price trending downwards from $0.695 to $0.633. The significant sell-off in the larger crypto market affects Ripple’s cryptocurrency.
The price of XRP has fallen about 13% in the last 24 hours and roughly 24% in the last week. Despite a 24% rise in trading volume, XRP’s market cap fell 11.17 percent in the last 24 hours. So its market share is currently 1.96 percent.
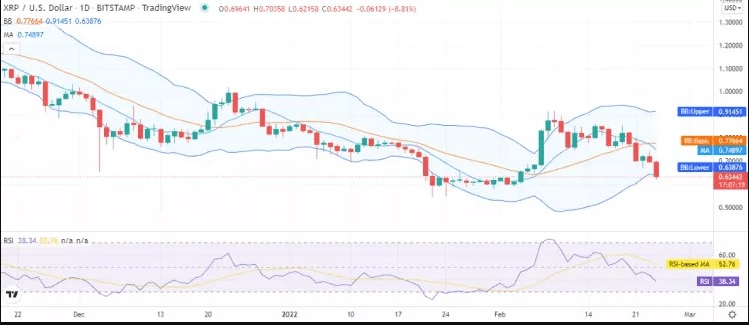
- XRP daily chart. TradingView
The MA also shows considerable bearishness after the 20-day and 50-day EMAs crossed. The Bollinger bands’ upper and lower bounds are far apart, indicating strong volatility. Even this divide is increasing.
-
Editor’s Choice
An Integrated Guide to Initial Game Offerings (IGO)
Gunnercooke, a UK-based law firm, Begins Accepting Cryptocurrency Payments
The resistance and support levels for XRP are $0.913 and $0.637, respectively. Bollinger band resistance is indicated by the XRP price falling below the band’s bottom limit. 37 RSI suggests neutrality. As a result, the prevailing market bias is confirmed.

- 4-Hour XRP Chart Review
The creation of red candlesticks on the 4-hour chart during the last 24 hours suggests that the bears are still in charge. But this chart also showed a 4 hour price decline in XRP.
- 4-hour XRP chart TradingView
Like the 24-hour chart, the 4-hour chart has a large gap between the Bollinger bands, indicating strong volatility. The maximum and lower limits on this chart correspond to $.803 and $0.632, respectively, with the average being $0.718.
The MA is currently below the volatility line. The RSI is also oversold at 27 and continues to fall, signaling strong selling pressure. The market meltdown today demonstrated the severe selling pressure hurting Ripple’s price. Regrettably, the downward trend in market values continues.


 Bitcoin
  Ethereum
  Tether
  Solana
  USDC
USDC  Lido Staked Ether
  XRP
XRP  Dogecoin
  Toncoin
  Cardano
  Shiba Inu
  Avalanche
  TRON
TRON  Wrapped Bitcoin
  Bitcoin Cash
  Polkadot
  Chainlink
  NEAR Protocol
  Polygon
  Internet Computer
  Litecoin
  Uniswap
  LEO Token
  Dai
Dai  First Digital USD
  Hedera
  Stacks
  Aptos
Aptos  Ethereum Classic
  Mantle
  Cronos
  Pepe
Pepe  Stellar
  Render
  Cosmos Hub
  dogwifhat
  Filecoin
  OKB
OKB  Renzo Restaked ETH
  Immutable
  Bittensor
  XT.com
  Arbitrum
  Maker
Maker  The Graph
  Optimism
  Wrapped eETH
2 Comments